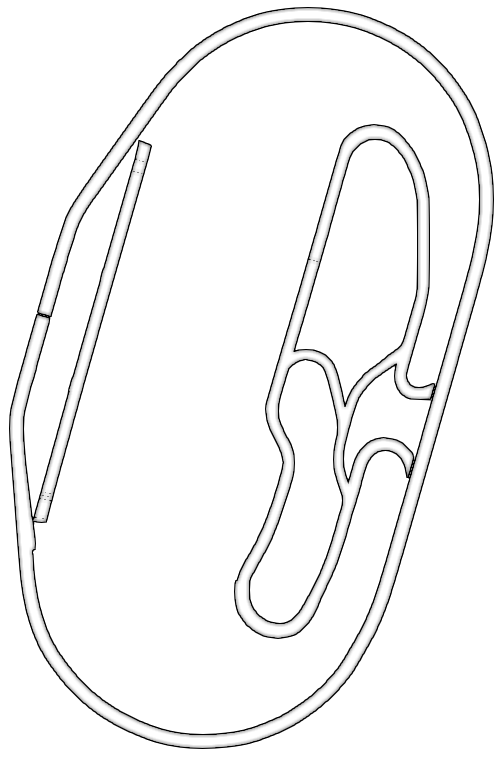
Texas Motor Speedway - Oval
06 Aug 24 12:26 PDT
Back to Results
Overview
| # | Name | Car | Qualifying Time | Average Lap | Laps |
|---|---|---|---|---|---|
| 1 | _SCSR_ NSG | NASCAR Cup Series 2009 - Toyota Camry (CoT) |
00:28.559 Tyre: S |
00:29.776 | 10 laps / 2 cuts |
| 2 | Flex_Playz | NASCAR Cup Series 2009 - Ford Fusion (CoT) |
00:29.077 Tyre: S |
00:30.689 | 8 laps / 1 cuts |
Car
Env
Rel
1st _SCSR_ NSG
in
NASCAR Cup Series 2009 - Toyota Camry (CoT)
Best:
00:28.559,
Potential: 00:28.434
| Lap # | Lap Time | Sector 1 | Sector 2 | Sector 3 | Cuts | Tyre |
|---|---|---|---|---|---|---|
| 1 | 00:35.394 | 00:18.555 | 00:05.134 |
00:11.705
S
S
|
0 | S |
| 2 | 00:29.952 | 00:11.596 | 00:05.009 | 00:13.347 | 1 | S |
| 3 | 00:43.613 | 00:25.649 | 00:05.185 | 00:12.779 | 1 | S |
| 4 | 00:29.027 | 00:11.991 | 00:05.084 | 00:11.952 | 0 | S |
| 5 |
00:28.559
L
L
|
00:11.838 |
00:04.936
S
|
00:11.785 | 0 | S |
| 6 | 00:28.919 |
00:11.793
S
|
00:05.094 | 00:12.032 | 0 | S |
| 7 | 00:31.948 | 00:14.043 | 00:05.615 | 00:12.290 | 0 | S |
| 8 | 00:29.732 | 00:12.101 | 00:05.104 | 00:12.527 | 0 | S |
| 9 | 00:29.720 | 00:12.161 | 00:05.369 | 00:12.190 | 0 | S |
| 10 | 00:30.530 | 00:11.865 | 00:05.480 | 00:13.185 | 0 | S |
2nd Flex_Playz
in
NASCAR Cup Series 2009 - Ford Fusion (CoT)
Best:
00:29.077,
Potential: 00:28.849
| Lap # | Lap Time | Sector 1 | Sector 2 | Sector 3 | Cuts | Tyre |
|---|---|---|---|---|---|---|
| 1 | 00:36.627 | 00:18.496 | 00:05.418 | 00:12.713 | 0 | S |
| 2 | 00:30.455 |
00:11.718
S
S
|
00:04.819
S
S
|
00:13.918 | 0 | S |
| 3 | 00:30.080 | 00:12.783 | 00:04.985 |
00:12.312
S
|
0 | S |
| 4 |
00:29.077
L
|
00:11.729 | 00:04.995 | 00:12.353 | 0 | S |
| 5 | 00:34.278 | 00:11.796 | 00:04.878 | 00:17.604 | 0 | S |
| 6 | 00:49.436 | 00:31.104 | 00:05.634 | 00:12.698 | 0 | S |
| 7 | 00:29.559 | 00:12.162 | 00:05.003 | 00:12.394 | 0 | S |
| 8 | 00:59.319 | 00:11.821 | 00:04.855 | 00:42.643 | 1 | S |